
$10,000 in Apple in January 2009 is worth over $1 million today

On January 2, 2009, the first trading day of the year, Apple closed at $90.75 a share. The financial crisis was at its worst, unemployment was climbing every month, and two weeks later Steve Jobs announced a medical leave. Almost nobody felt like buying anything.
Suppose you had put $10,000 into Apple that day anyway. You would have bought about 110 shares. Apple has since split its stock twice, 7-for-1 in 2014 and 4-for-1 in 2020, so those 110 shares are now about 3,085 shares, without you buying a single extra one.
At the October 5, 2026 close of $332.89, those 3,085 shares are worth $1,027,099. That is about 103 times the money, or roughly 30% a year for almost eighteen years. If you had also reinvested the dividends Apple started paying in 2012, it would be about $1,226,431.
How $10,000 grew
| Date | In Apple | In the S&P 500 |
|---|---|---|
| January 2009 | $10,000 | $10,000 |
| Start of 2010 | $23,221 | $11,988 |
| Start of 2012 | $44,628 | $13,500 |
| Start of 2014 | $61,820 | $19,868 |
| Start of 2016 | $81,192 | $21,931 |
| Start of 2018 | $130,536 | $28,707 |
| Start of 2020 | $226,507 | $34,623 |
| Start of 2022 | $547,874 | $51,093 |
| Start of 2024 | $594,032 | $51,131 |
| Start of 2026 | $838,797 | $73,356 |
| October 5, 2026 | $1,027,099 | $83,351 |
Closing prices from Yahoo Finance, adjusted for splits, dividends not included. The S&P 500 column is the SPDR S&P 500 ETF (SPY).
The hard part was holding it
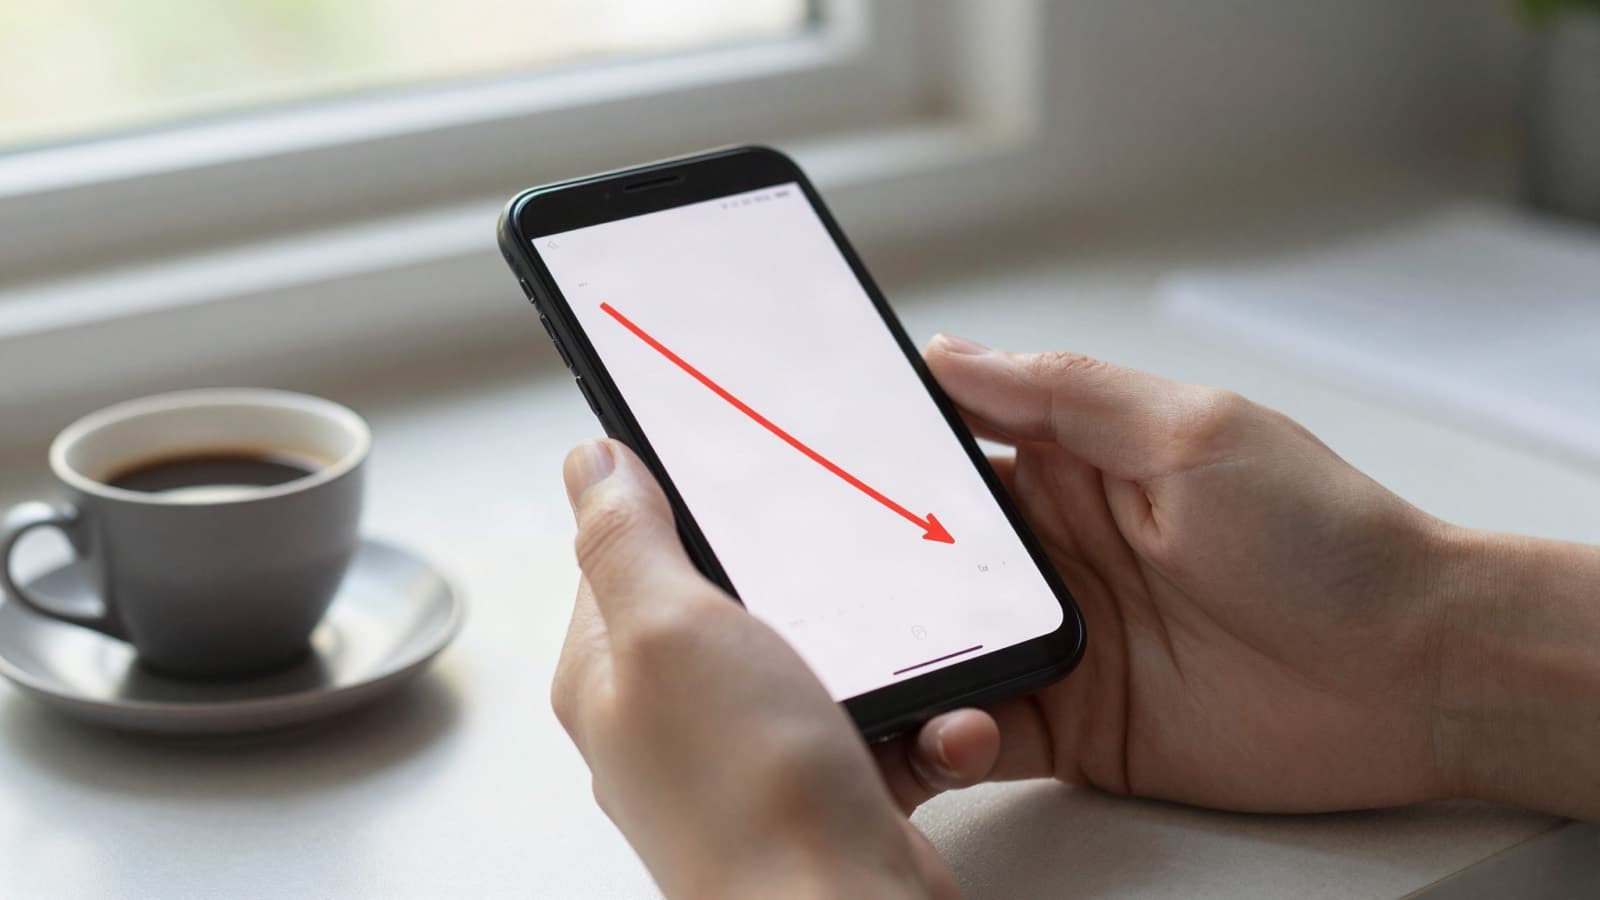
The table makes it look smooth. It wasn’t. Along the way, Apple lost a third of its value or close to it six times:
- 44% between September 2012 and April 2013,
- 32% between February 2015 and May 2016,
- 39% between October 2018 and January 2019,
- 31% in five weeks in early 2020, as the pandemic hit,
- 31% through 2022,
- 33% between December 2024 and April 2025.
Each time, the news explained why it was over for Apple. Each time, selling would have felt sensible. The million dollars went only to the person who did nothing: who held through every one of those falls and kept going.
Why investing matters more than the pick
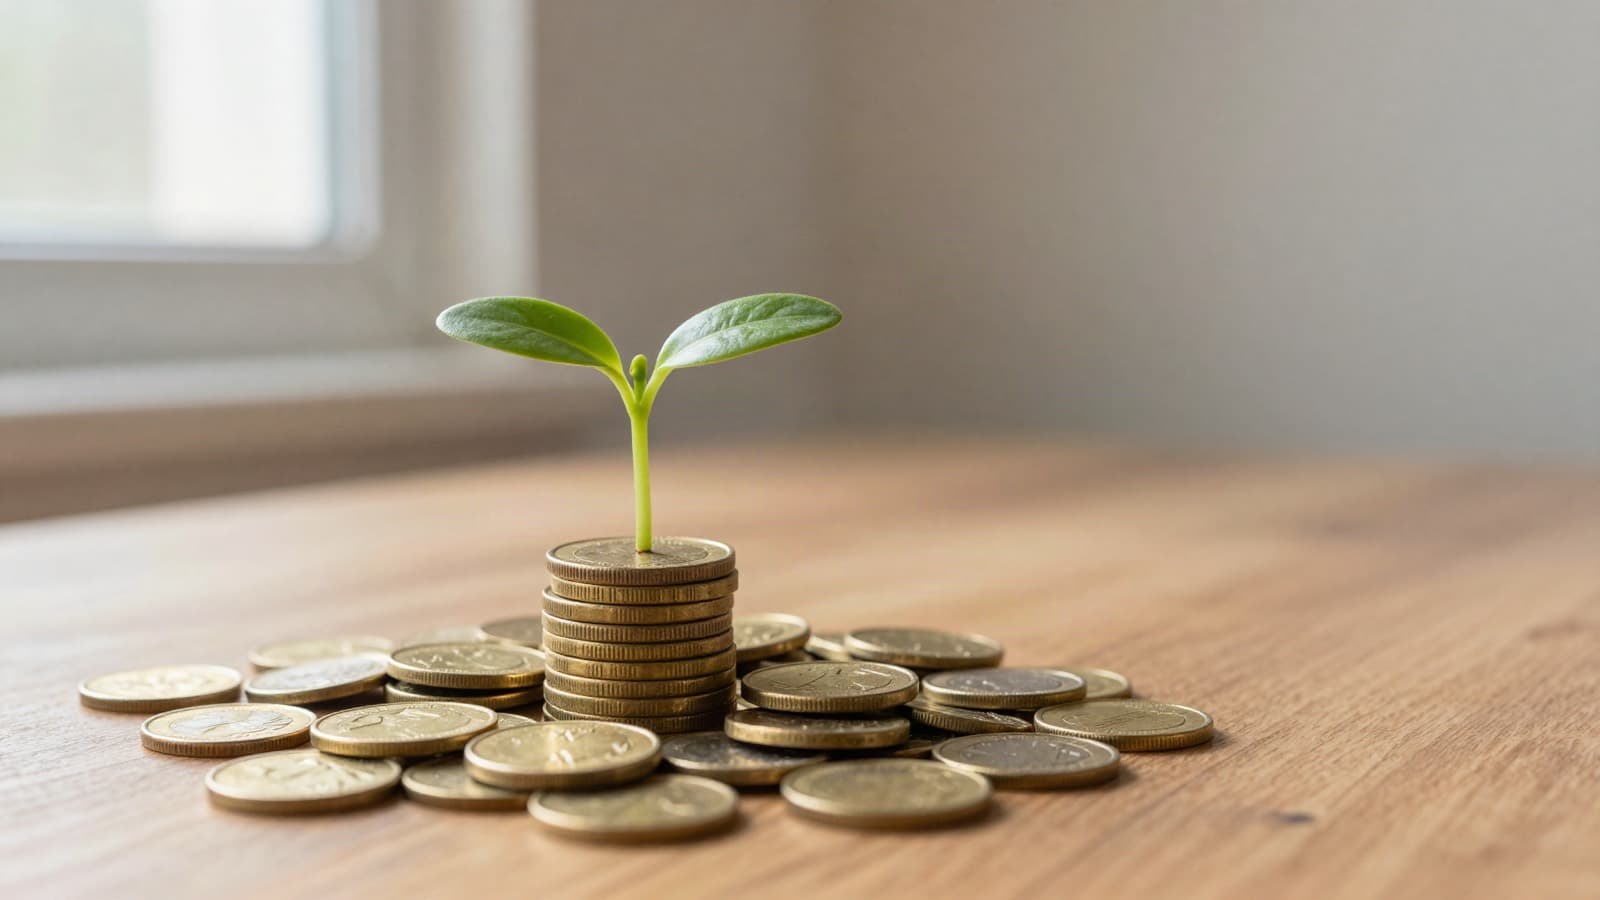
Picking Apple in 2009 is easy in hindsight, and nobody should pretend they would have known. Plenty of famous names from 2009 did far worse. But look at the other column. The same $10,000 in a plain S&P 500 index fund, with no stock picking at all, became $83,351, or about $114,554 with dividends reinvested. That is more than eleven times the money, from simply owning the market.
And $10,000 left in a bank account? It is still $10,000, and after almost eighteen years of rising prices it buys a good deal less than it did. Not investing is a decision too, and it has a cost. You just never see the bill.
A few lessons carry over to any market:
- Time does most of the work. Compounding is slow for years and then very fast. The $10,000 took six years to reach its first $100,000; in the last twelve months alone it added about $235,000.
- Start before it feels comfortable. The best entry points usually look terrible at the time. January 2009 certainly did.
- Staying invested beats timing. Missing a handful of the best days, which tend to come right after the worst ones, takes a large bite out of long-run returns.
- Spread your risk. One stock can make you rich or wipe you out. An index fund will never be Apple, but it will never be the company that went to zero either.
- Small and regular counts. You don’t need $10,000 to start. Investing a little every month means you buy through the falls too, which is exactly when prices are lowest.
Follow people who actually hold
Holding through a 40% fall is far easier when you can see that others are doing it with real money. On Stock Locker, traders’ portfolios are read straight from their brokers, exchanges and wallets, so what they hold and how long they held it is on the record. See the leaderboard.
This article is for education only and is not investment advice. Past performance does not predict future returns, and any investment can lose value. Figures are based on closing prices and ignore taxes, fees and trading costs. Photos are illustrative and were generated with AI; the charts are drawn from real prices. See our disclosures.